AWS can dig a crater in your pocket (if not you, then your client’s). Also, post-downtime meetings with clients can get sour for the right metrics going unmonitored.
I have been working with AWS since a while now and have learned it the difficult way that just spinning up the infrastructure is not enough. Setting up monitoring is a cardinal rule. With the proliferation of cloud and microservice-based architecture, you cannot possibly gauge the usage, optimize the cost or ascertain when to scale up or scale down without monitoring.
This is not a post on why monitoring is required but rather on why and how to enhance your monitoring using custom metrics for AWS-specific infrastructure on CloudWatch. While CloudWatch provides ready metrics for CPU, network bandwidth—both in and out, disk read, disk write and a lot more it does not provide memory and disk metrics. And, considering you are reading this post on custom metrics, you already know that monitoring just the CPU without memory and disk is simply not enough.
Why doesn’t AWS provide CPU and Disk Metrics by default like it provides the rest?
Well, CPU metrics, network metrics for EC2 can be fetched externally, while for monitoring memory and disk access to the servers is required. AWS does not have access to your servers by default. You need to be inside the server and export the metrics at regular intervals. This is what I have done as well to capture the metrics.
The following are the custom metrics we should monitor:
• Memory Utilized (in %)
• Buffer Memory (in MB)
• Cached Memory (in MB)
• Used Memory (in MB)
• Free Memory (in MB)
• Available Memory (in MB)
• Disk Usage (in GB)
Why did I create these playbooks? Why use custom metrics to monitor?
• Memory metrics are not provided by AWS CloudWatch by default and require an agent to be installed. I have automated the steps to install the agent and added a few features.
• The base script provided by Amazon didn’t output some metrics to be exported to CloudWatch like buffer memory and cached which didn’t give a clear picture of the about the memory.
• There were times when the free memory would indicate 1–2GB but the cached/buffer would be consuming that memory and not release it, thereby depriving your applications of memory.
• Installing the agent on each server and adding to the cron was challenging. Especially if you frequently create and destroy VMS. Why not just use Ansible to install it in one go to multiple servers?
So how do we set up this monitoring?
It’s fairly simple:
1. Install Ansible on machine / local
2. Clone the repo https://github.com/alokpatra/aws-cloudwatch.git
3. $ git clone https://github.com/alokpatra/aws-cloudwatch.git
4. Populate the host file with the servers details you want to monitor
5. Allow CloudWatch access to EC2 by attaching an IAM role the target hosts you want to monitor. To attach a role go to the Instance section of the AWS Console. Select the instance > Click on Actions > Instance Settings > Attach/Replace IAM Role
6. Run the playbook
7. Create your own custom dashboards on AWS CloudWatch Console.
While I have detailed out the ReadMe in the GitHub repo, I’ll just discuss a few things in brief here:
What do the scripts do precisely?
Well, the scripts are an automated and improvised version of the steps to deploy the CloudWatch agent. Since I had extensively used Ansible previously, I wrote an Ansible role to simplify deployment of multiple server agents.
The Ansible role does the following:
• Identifies the distribution
• Installs the pre-requisites as per the OS flavor
• Installs the prerequisite packages based on the distribution
• Copies the Perl scripts to the target machine.
• Sets the cron job to fetch and export the metrics at regular intervals (default of 5mins)
Minor changes to the Perl script have been made also to export the cached and buffer memory which I found quite useful.
Supported OS Versions
• Amazon Linux 2
• Ubuntu
Prerequisites:
1. Ansible to be installed on the Host Machine to deploy the scripts on the target machines/servers. I have used Ansible Version 2.7.
• To install ansible on Ubuntu you can run the following commands or follow this link
$ sudo apt update $ sudo apt install software-properties-common $ sudo apt-add-repository ppa:ansible/ansible $ sudo apt update $ sudo apt install ansible”‘
• On Amazon Linux 2 you need to run the following commands, obviously, there is no Digital Ocean Guide to follow
$ sudo yum-config-manager — enable epel $ yum repolist ( you should see epel) $ yum install ansible
2. CloudWatch access to Amazon EC2. The EC2 instances need to have access to push metrics to CloudWatch. So you need to create an IAM role ‘EC2AccessToCloudwatch’ and attach the policy to allow ‘write’ access for EC2 to CloudWatch. Now attach this IAM role to the target hosts you want to monitor. In case you already have a role attached to the instance, then add the above policy to that role.
The other alternative is to export the keys to the servers. (Playbooks are not updated for this option yet). I have used the IAM option which avoids the need to export keys to the server which can often be a security concern. It is also difficult to rotate the credentials subsequently.
3. SSH access to the target hosts i.e. the hosts where you want the agent installed since Ansible uses SSH to connect to managed hosts.
What do the playbooks exactly do?
• Identify the Distribution
• Install the pre-requisites as per the OS flavor
• Install the prerequisite packages based on the distribution
• Copy the Perl scripts to the target machine
• Set the cron job to fetch and export the metrics at regular intervals (default of 5mins)
How to run the playbooks?
• Populate the inventory/host file with the hosts/IPs. A sample host file is present in the repo
• Run the main playbook with the following command which in turn calls the role CloudWatch-agent $ ansible-playbook -i hosts installer.yaml -vv“`
This would install the agent. Now you can go ahead and create the Dashboards on CloudWatch
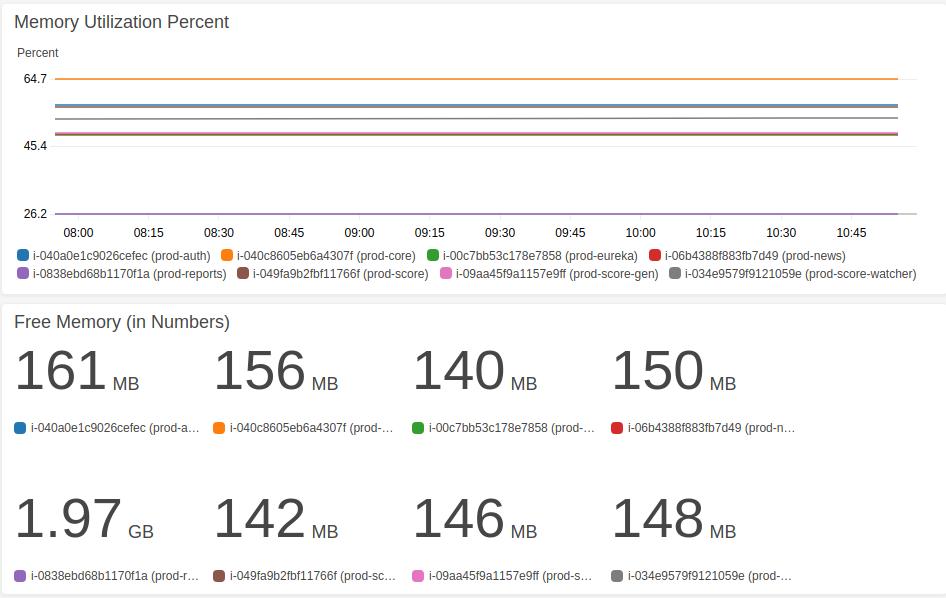
Below is a sample Dashboard I have created. You might want to customize the widgets as per your requirement.
The below dashboard has 2 widgets:
i. It gives a high-level picture of the overall Memory Utilization Percent. This tells you which server is running on high memory and the spikes if any.
ii. Free Memory (in MB). This is read after the one above to obtain free memory on a particular server you see has high utilization.

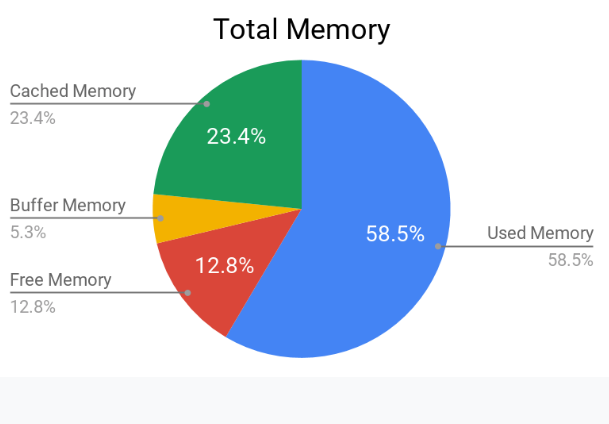
Before the next Dashboard which is a level deeper, let’s just glance at the Total Memory Pie Chart.

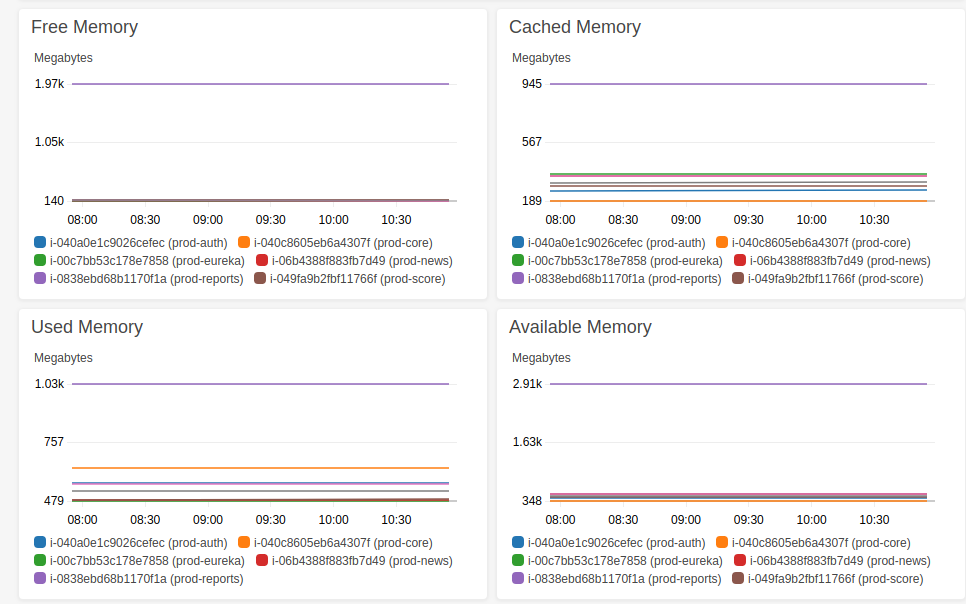
The following Dashboard is to dig deeper into the memory metrics. To understand the exact distribution of memory and where it is consumed.

Hope the post was useful.
Cheers!
Happy Monitoring!


