In previous blog of this series, we talked about deciding factors for tool selection, POC, suite creation and suite testing.
Now moving one step further we’ll talk about next steps like command-line execution of postman collections, integration with CI tool, monitoring etc.
Thus I have structured this blog into following phases:
- Command-line execution of postman collection
- Integration with Jenkins and Report generation
- Monitoring
Command-line execution of postman collection
Postman has a command-line interface called Newman. Newman makes it easy to run a collection of tests right from the command line. This easily enables running Postman tests on systems that don’t have a GUI, but it also gives us the ability to run a collection of tests written in Postman right from within most build tools. Jenkins, for example, allows you to execute commands within the build job itself, with the job either passing or failing depending on the test results.
The easiest way to install Newman is via the use of NPM. If you have Node.js installed, it is most likely that you have NPM installed as well.
$ npm install -g newman
Sample windows batch command to run postman collection for a given environment
newman run https://www.getpostman.com/collections/b3809277c54561718f1a -e Staging-Environment-SLE-API-Automation.postman_environment.json –reporters cli,htmlextra –reporter-htmlextra-export “newman/report.html” –disable-unicode –x
Above command uses cloud URL of collection under test. If someone doesn’t want to use cloud version, it is possible to import the collection JSON and pass the path in the command. The generated report file clearly shows the passed/failed/skipped tests along with request and responses and other useful information. In the post-build actions, we can add steps to email the attached report to intended recipients.
Integration with Jenkins and Report generation
Scheduling and executing postman collection through Jenkins is a pretty easy job. First, it requires you to install all the necessary plugins as needed.
E.g. We installed the following plugins:
- js –For Newman
- Email extension –For sending mails
- S3 publisher –For storing the report files in aws s3 bucket
Once you have all the required plugins, you just need to create a job and do necessary configurations for:
- Build triggers – For scheduling the job (time and frequency)
- Build – Command to execute the postman collection.
- Post build actions –Like storing the reports at the required location, sending emails etc.
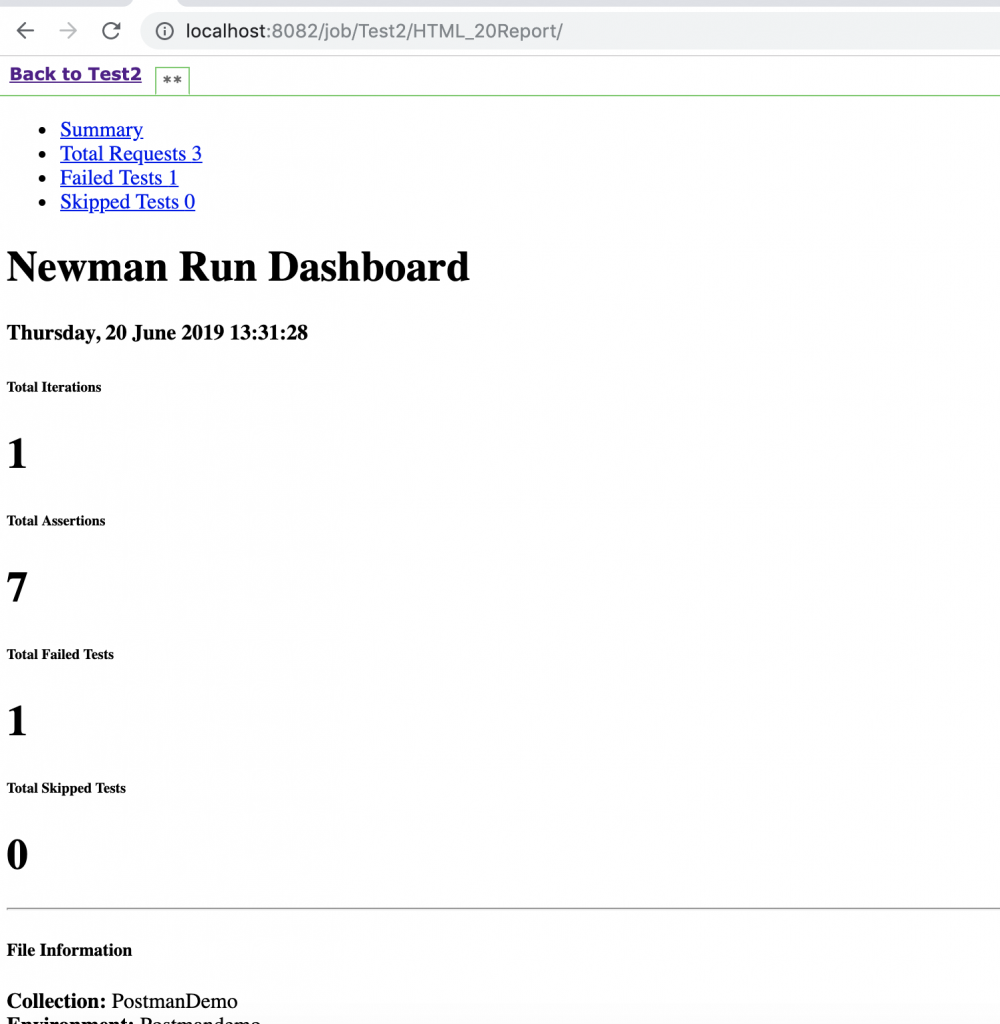
If you notice, the test execution Newman report generated after Jenkins build execution looks something as shown in Figure 1:

Figure 1: Report in plain format due to Jenkins’s default security policy
This is due to one of the security features of Jenkins i.e. to send Content Security Policy (CSP) headers which describes how certain resources can behave. The default policy blocks pretty much everything – no JavaScript, inline CSS, or even CSS from external websites. This can cause problems with content added to Jenkins via build processes, typically using the Plugin. Thus with the default policy, our report will look something like this
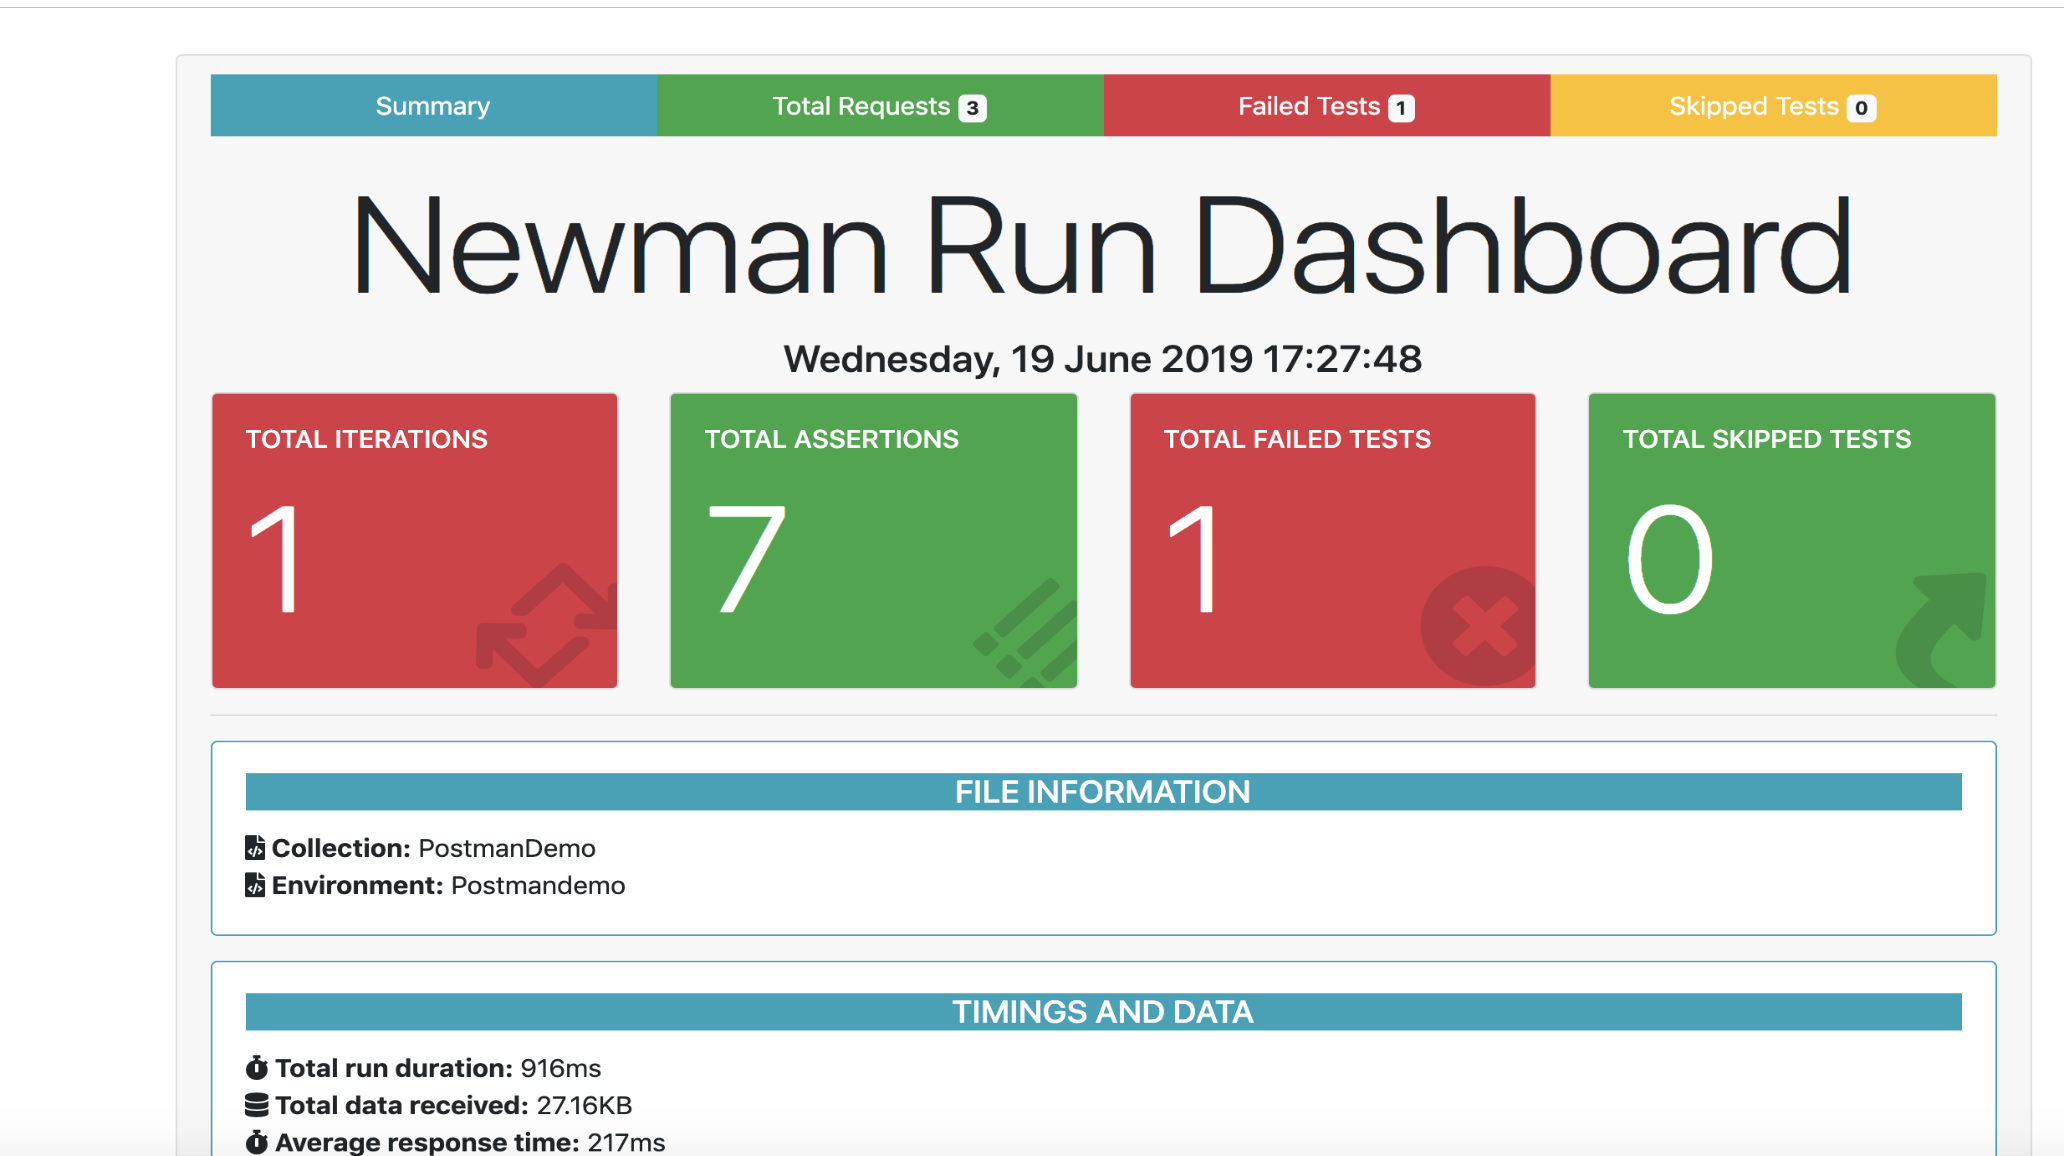
Therefore it requires modifying the CSP to see the visually-appealing version of the Newman report. While turning this policy off completely is not recommended, it can be beneficial to adjust the policy to be less restrictive, allowing the use of external reports without compromising security. Thus after making the changes, our report will look at something as shown in Figure 2:

Figure 2: Properly formatted Newman report after modifying Jenkins’s Content Security Policy
One of the ways to achieve this is through making changes in the jenkins.xml file, which is located in your main Jenkins installation to permanently changing the Content Security Policy when Jenkins is running as a Windows Service. Simply add your new argument to the arguments element, as shown in Figure 3, save the file and restart Jenkins.

Figure 3: Sample snippet of Jenkins.xml showing modified argument for relaxing Content Security Policy
Monitoring
As we see in Jenkins integration, we have fixed the job frequency using the Jenkins scheduler, which means we have restricted our build to run at particular times in a day. This solution is working for us for now but what if someone wants it in such a way that stakeholders are getting informed whenever there is a failure and needs to be looked upon rather than spamming everyone with the regular mails even if everything passes.
One of the best ways is to have the framework integrated with code repository management system and trigger the automation whenever a new code change related to the feature is pushed and send report mail when any failure is detected by the automation script.
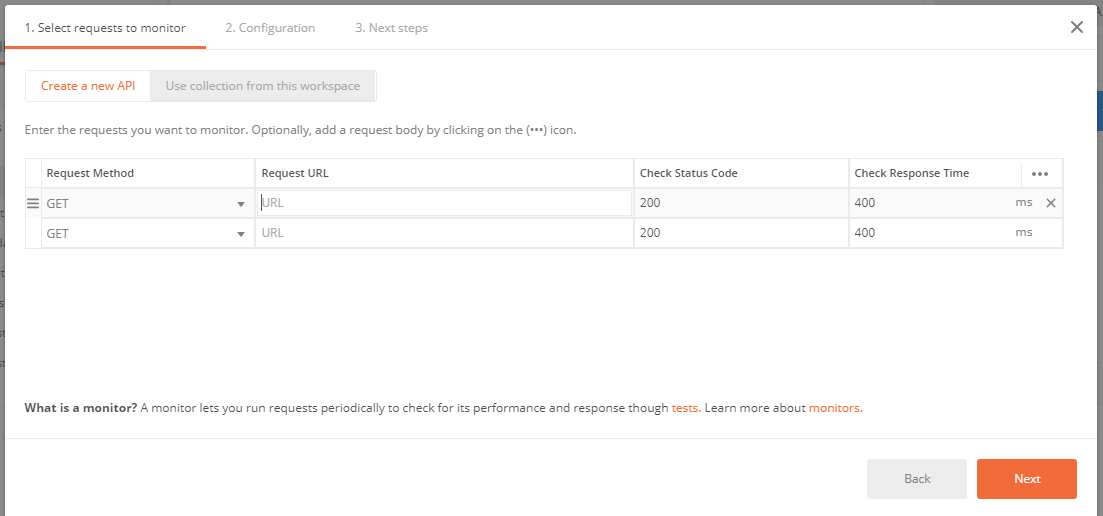
Postman provides a better solution in terms of monitors that lets you stay up to date on the health and performance of your APIs, Although we have not used this utility since we are using the free version and it has a limit of 1,000 free monitoring calls every month. You can create a monitor by navigating to New->Monitor in Postman. (Refer to Figure 4)
Postman monitors are based on collections. Monitors can be scheduled as frequently as every five minutes and will run through each request in your collection, similar to the collection runner. You can also attach a corresponding environment with variables you’d like to utilize during the collection run.
The value of monitors lies in your test scripts. When running your collection, a monitor will use your tests to validate the responses it’s receiving. When one of these tests fail, you can automatically receive an email notification or configure the available integrations to receive alerts in tools like Slack, Pager Duty, or HipChat.

Figure 4: Adding Monitor in Postman
Here we come to an end of this blog as we have discussed all the phases of postman end to end usage in terms of what we explored or implemented in our project. Hope this information helps in setting up an automation framework through postman in some other project as well.
Check Out: API test automation using Postman simplified: Part 1


