Introduction
Riemann is a next generation Open-Source Push-Based monitoring system, which is designed to scale vertically and horizontally with the infrastructure, making it a good choice for monitoring elastic infrastructure. Riemann provides transient shared state for system with many moving parts. Riemann aggregates events from the servers and applications with a powerful stream processing language.
Monitoring systems are divided on the following mechanisms:
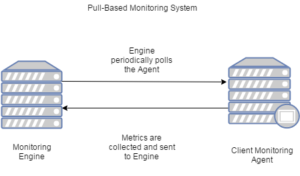
- Pull–Based Monitoring: Pull–Based monitoring system follows Client-Server architecture. Client monitoring agents are installed on computing machines that require monitoring; agents collect the monitoring metrics from these computing machines. Monitoring engine is installed on a server. Client monitoring agents must register with monitoring engine before exchanging data. Monitoring engine polls the monitoring client agents and collects the information from the agents and displays it on a web–based dashboard. For e.g.: Nagios
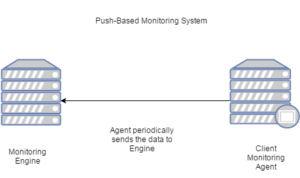
 2. Push-Based Monitoring: Push–Based monitoring system follows Client-Server architecture. Client monitoring agents are installed on the computing machines that require monitoring. Monitoring engine is installed on a server. Client monitoring agents are not required to register to Monitoring Engine. Client monitoring agents initiate communication to Central Server and sends the metrics periodically. For e.g.: DataDogHQ, Riemann

Why Push Based Monitoring System
Push-Based monitoring system scales well with Cloud systems, which use auto-scaling heavily, as the new instances are not required to register with the Monitoring Engine, making monitoring easy and scalable as compared to Pull-Based monitoring systems.
Riemann Concepts
Events
Events are structs that are sent over protocol buffers. Following are some of the events:
- host : A hostname, e.g. “api1”, “foo.com”
- service : An application or operating system service, e.g. “API port 8000 reqs/sec”
- state : Any string less than 255 bytes, e.g. “ok”, “warning”, “critical”
- time : The time of the event, in unix epoch seconds
- description : Freeform text
- tags : Freeform list of strings, e.g. [“rate”, “fooproduct”, “transient”]
- metric : A number associated with this event, e.g. the number of reqs/sec.
- ttl : A floating-point time, in seconds, that this event is considered valid for. Expired states may be removed from the index.
Apart from the standard fields, custom fields can also be sent in the event.
Index
The index is a table of the current state of all the services tracked by Riemann. Each event is uniquely indexed by its host and service. Events have a :ttl field, which indicate how long the event is valid for. Events that sit in the index for longer than their TTL are removed from the index and re-entered into the stream as an expired event.
Streams
Streams acts as the source from which all the events begin to flow.
Installing Riemann
Riemann provides the packaged installation for Fedora and Debian based systems. For other systems, there is a tar-ball package. Connect to a system via SSH (Putty, MobaXterm, Cmder) and download the tar-ball package in the /opt directory.
1. For downloading the tar-ball package, execute the following command:
wget https://aphyr.com/riemann/riemann-0.2.11.tar.bz2
2. For extracting the tar-ball, execute the following command:
tar xvfj riemann-0.2.11.tar.bz2
3. In order to start Riemann, execute the following command:
bin/riemann etc/riemann.config
Configuring Riemann
Riemann is configured through riemann.config, which has syntax and semantics of Clojure programming language.To edit the Riemann config file, execute the following command:
vim etc/riemann.config
- Logging location and preferences are configured through logging/init function.
(logging/init {:file "/var/log/riemann/riemann.log"})
2. Binding hostname is configured through host variable of configuration file.
(let [host "127.0.0.1"]

(tcp-server {:host host})

(udp-server {:host host})

(ws-server  {:host host}))
3. Event expiration of a Riemann event is set through periodically-expire function.
(periodically-expire 5)
4. Streams function includes the configuration for expired Riemann events and :ttl configuration for active Riemann events.
(let [index (index)]

; Inbound events will be passed to these streams:

(streams

(default :ttl 60

; Index all events immediately.index

; Log expired events.

(expired

(fn [event] (info "expired" event))))))
From the configuration file you can observe the following:
- Logs are getting generated at /var/log/riemann/riemann.log.
- Host is binded at 127.0.0.1. Riemann can be enabled to listen on all interfaces by changing 127.0.0.1 to 0.0.0.0.
You can optionally add the following snippet at the end of configuration file that will print all the events in INFO mode in riemann.log:
(streams

prn#(info %))
Installing Riemann Dashboard
Riemann Dashboard can be installed via riemann-dash gem.
- Installing the riemann dash gem, execute following command:
$gem install riemann-dash
2. In order to start the dashboard, execute the following command:
$riemann-dash
By default, Riemann dashboard starts at the 4567 port. You can modify the dashboard configuration via the config.rb file in the directory from where you launched the dashboard. Riemann dashboard is fully customizable and can be modified.
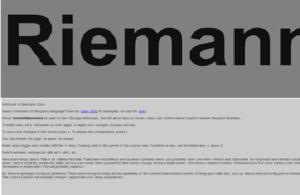
- Go to browser (Firefox, Chrome) and enter the URL, http://riemannserver:4567/. Following screen appears:

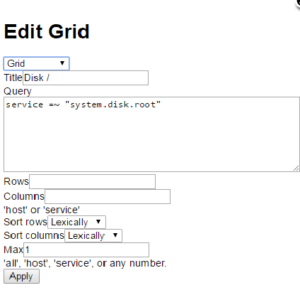
2. Press Ctrl + Click to select the view. Press ‘e’ to enter the following screen:

3. Enter the query service =~ “system.root.disk”, it will list disk related information of the instances.
Publishing data to Riemann
Now, the monitoring engine is up and running. You will require the monitoring client agents to publish the data to Riemann. Riemann has standard set of tools to monitor standard set of services. Check this https://github.com/riemann/riemann-tools.
Apart from standard set of tools, it is also possible to write custom tools in major programming languages like Python, Ruby, Java, and Clojure. Here at Talentica, we write custom tools in Clojure programming language to collect specific metrics from Apache Kafka, Redis, and then pass it to Riemann.


