Microservices architecture serves as the backbone of Amazon, Spotify, Uber, and Netflix’s products. This architectural approach unites these tech giants in delivering reliable and scalable solutions. Since microservices are highly decoupled, which makes testing each service in isolation essential to identify. To address any issues early in the development cycle, test coverage is crucial in a microservice architecture as it ensures each service behaves as expected and interacts correctly with other services.
Comprehensive testing can also prevent issues from spreading across the system while reducing the risk of cascading failures. In a nutshell, the test can improve the system’s reliability, functionality, and quality. This is where JaCoCo, a code coverage tool, has emerged as a valuable resource, proving its efficacy in ensuring reliable service delivery.
But you must perform unit tests, integration tests, and end-to-end tests to deliver a high-quality product to the user. A code coverage report using a tool like JaCoCo, in QA (Quality Assurance) can give you the upper hand with valuable insights into the effectiveness of a software testing process.
Here are some limitations of unit tests when compared to integration or end-to-end tests:
- Limited scope: Unit tests only test individual units of code in isolation. They do not test the interactions between different units or the system as a whole. It can lead to some issues going undetected until integration or end-to-end testing.
- Lack of real-world scenarios: Unit tests are based on the implementation of the code and may only cover some possible scenarios that might occur in a real-world environment. It can result in defects only found during integration or end-to-end testing.
- Inability to detect system-level issues: Unit tests do not test the entire system, so they may not detect system-level issues such as scalability, performance, or security problems that can only be detected through integration or end-to-end testing.
- Dependence on mocks and stubs: Unit tests often rely on mocks and stubs to simulate dependencies and external systems. While this can help isolate the unit being tested, it can also introduce false positives or negatives if the mock or stub does not accurately simulate the real behavior.
- Maintenance overhead: Maintaining unit tests can be time-consuming and expensive, especially if the code being tested changes frequently. It can result in tests becoming outdated and no longer representative of the current system, leading to potential issues being missed.
Thus, while unit tests are an essential component of a comprehensive testing strategy, they have some limitations compared to integration or end-to-end tests. It is necessary to use a mix of tests to ensure the web application is rigorously tested and complies with the required quality benchmarks.
But Why Code Coverage In Testing?
Code coverage in testing summarizes the percentage of code or functionalities covered by manual and automated tests (functional UI automation, E2E, API tests, etc.). The benefits of having such a report are:
- Identifying gaps in testing: A code coverage report helps identify areas of an application that are not adequately covered by automated tests. This information can be used to identify missed or edge test cases, prioritize testing efforts and ensure that all critical functionality is thoroughly tested.
- Assessing the quality of test cases: A coverage report can be used to evaluate the quality of test cases. If the coverage is low, it indicates that some test cases may need to be adequately designed or that the tests are not covering the intended functionality.
- Improved test maintenance: The report can help maintain test cases over time by highlighting areas that have changed since the last test run. This information can be used to update the tests and ensure that they remain relevant.
- Early identification of defects: By analyzing the coverage report, QA teams can identify application areas prone to defects. It will help design more targeted test cases and catch defects early in development.
- Improved communication: A code coverage report clearly shows the testing efforts and coverage achieved. Such information can be shared with stakeholders to demonstrate the testing progress and assure them that the application is being thoroughly tested.
On the plus side, the test helps in finding defects early and keeps stakeholders informed of the testing progress.
Using Jacoco For Code Coverage
JaCoCo is a popular open-source tool for measuring code coverage in Java applications. It provides detailed information on the number of lines, branches, instructions covered by tests, and the percentage of code covered by tests.
JaCoCo is integrated with all the microservices such that whenever these services start, they capture the events performed on the application via manual/automated tests. JaCoCo employs class file instrumentation to capture data on the coverage of code execution.
Challenges
JaCoCo has its limitations when it comes to microservices and you must avoid them.
- JaCoCo tool typically generates the test execution data (in .exec format) only after the service/server is stopped. In a multi-container environment, the corresponding container is destroyed once the service stops. Hence, you can’t fetch the test coverage file that is thereby used to generate the coverage reports.
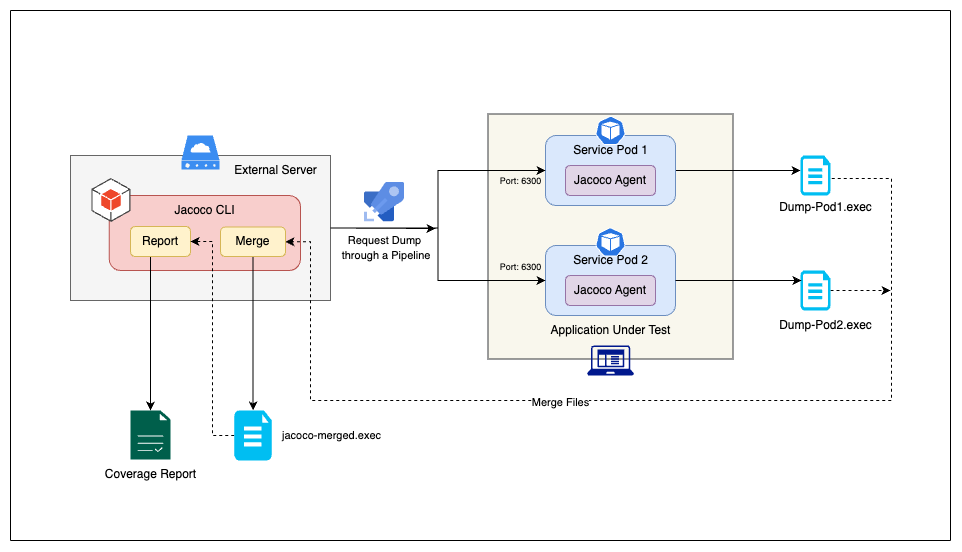
- Suppose more than one k8 pods are being spawned/scaled to support a microservices. In that case, you need to fetch the individual execution files from all the respective pods and merge them into a single file to generate a joint report.
- We need to ensure that the collection of test execution data occurs without stopping the microservices/server.
- After each service restarts, the name of the pod changes. Hence, you need to dynamically fetch its name to access them for getting coverage data.
Solution

The TCPSocketServer connection allows the JaCoCo agent to gather execution information and store it until requested. By using an external tool to connect to the JVM, execution data can be retrieved over the socket connection. The agent is configured to listen for incoming connections on the TCP port indicated by the address and port attribute and will continue to write execution data to the TCP connection while the service runs.
To execute fundamental actions using JaCoCo, you can leverage its command line interface. For this purpose, the tool provides jacococli.jar, which bundles all the required dependencies for the command line tools.
Fetch the dump containing execution data from different running pods and merge them into a single file using JaCoCo CLI. A single consolidated report is then generated using JaCoCo CLI that includes the coverage data for the Automated/manual E2E/Integration/API tests.
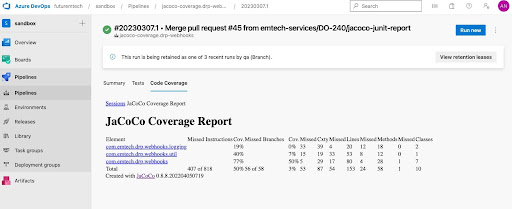
This solution can also be integrated with various CI/CD pipelines, e.g., Azure pipelines. Anyone can trigger the respective microservice pipeline to fetch the test coverage reports without manual intervention.
Commands
You can install azure-cli and kubectl in your system.
Set up JAVA_OPTIONS
Integrate the jacoco-agent with the micro-services.
JAVA_OPTIONS: ” -Xms600m -Xmx1024m -javaagent:dd-java-agent.jar -javaagent:org.jacoco.agent-runtime.jar=output=tcpserver,includes=*,address=localhost,port=6300″
Login into azure-cli & set subscriptions:
az login
az account set –subscription $SUBSCRIPTION_ID
az aks get-credentials –resource-group $RESOURCE_GROUP –name $NAME
Fetch the name of the corresponding pod name (service):
kubectl get pods -n applications
Connect to the service and request the dump while the service is running:
kubectl exec -i $POD_NAME1 -n applications — java -jar org.jacoco.cli-nodeps.jar dump –destfile dump.exec
Copy the dump to some external location path:
kubectl cp applications/$POD_NAME:dump.exec $EXEC_PATH1
Repeat the above steps to fetch the multiple .exec file from the different pods used for a particular micro-service:
kubectl exec -i $POD_NAME2 -n applications — java -jar org.jacoco.cli-nodeps.jar dump–destfile dump.exec
kubectl cp applications/$POD_NAME2:dump.exec $EXEC_PATH2
Merge the multiple .exec files to generate a common test execution data file for a microservice:
java -jar $JACOCO_CLI_JAR_PATH merge $EXEC_PATH1 $EXEC_PATH2 –destfile
$EXEC_PATH_MERGED
Generate the test coverage report:
java -jar $JACOCO_CLI_JAR_PATH report $EXEC_PATH_MERGED –html $REPORT_PATH –classfiles
${CLASSFILES[0]} –sourcefiles ${SOURCEFILES[0]}
Details on the above commands can also be found here.
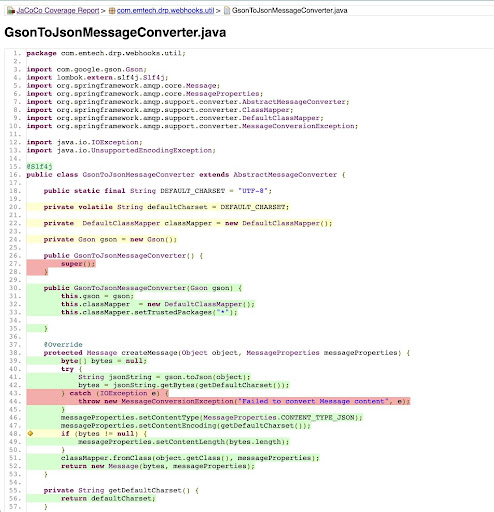
Reports


Conclusion
JaCoCo is an effective and widely used code coverage tool in testing that can provide engineers with valuable insights into their code base’s test coverage. By using JaCoCo, teams can identify areas of their code that need to be adequately tested and ensure that their manual and automated tests exercise all of the critical functionality of their application. JaCoCo’s ease of use and integration with popular testing frameworks make it a popular choice for teams looking to improve the quality of their code and ensure that their applications are reliable and bug-free.


