What’s ELK Stack?
“ELK” is the acronym for three open source projects: Elasticsearch, Logstash, and Kibana.

Introduction: ELK services:
Elasticsearch: It’s a search and analytics engine.
Logstash: It’s a server‑side data processing pipeline that is for centralized logging, log enrichment and parsing
Kibana: It lets users visualize data with charts and graphs in Elasticsearch.
Note: I will be using Amazon EC2 instances with Ubuntu 16.04 LTS operating system for whole ELK and alerting setup.

We need Java8 for this setup first!!!

- Setup Java8 on Ubuntu EC2 server by following commands:
$ sudo add-apt-repository -y ppa:webupd8team/java
$ sudo apt-get update -y
$ sudo apt-get -y install oracle-java8-installer
Lets Start with ELK services setup !!!

1) Setup Elasticsearch in our Ubuntu EC2 servers:
- Download and install the public signing key:
$ wget -qO – https://artifacts.elastic.co/GPG-KEY-elasticsearch | sudo apt-key add –
- Installing from the APT repository
$ sudo apt-get install apt-transport-https
- Save the repository definition to /etc/apt/sources.list.d/elastic-5.x.list:
$ echo “deb https://artifacts.elastic.co/packages/5.x/apt stable main” | sudo tee -a /etc/apt/sources.list.d/elastic-5.x.list
- Finally install Elasticsearch
$ sudo apt-get update && sudo apt-get install elasticsearch
- After installing Elasticsearch , do following changes in configuration file “elasticsearch.yml”:
- Changes in configuration file:
$ sudo vim /etc/elasticsearch/elasticsearch.yml
“network.host” to localhost
- After saving and exiting file:
$ sudo systemctl restart elasticsearch
$ sudo systemctl daemon-reload
$ sudo systemctl enable elasticsearch
2) Setup Kibana in our Ubuntu EC2 servers:

- Download and install the public signing key:
$ wget -qO – https://artifacts.elastic.co/GPG-KEY-elasticsearch | sudo apt-key add –
- Installing from the APT repository
$ sudo apt-get install apt-transport-https
- Save the repository definition to /etc/apt/sources.list.d/elastic-5.x.list:
$ echo “deb https://artifacts.elastic.co/packages/5.x/apt stable main” | sudo tee -a /etc/apt/sources.list.d/elastic-5.x.list
- Finally install Kibana
$ sudo apt-get update && sudo apt-get install kibana
- After installing Kibana, do following changes in configuration file “kibana.yml”:
- For doing changes in cnfiguration file:
$ sudo vim /etc/kibana/kibana.yml
“server.host” to localhost.
- After saving and exiting file:-
$ sudo systemctl restart kibana
$ sudo systemctl daemon-reload
$ sudo systemctl enable kibana
3) Setup Nginx for Kibana UI:

- Following commands to install nginx:
$ sudo apt-get -y install nginx
$ echo “kibanaadmin:`openssl passwd -apr1`” | sudo tee -a /etc/nginx/htpasswd.users
- Change nginx configuration file to listen at port 80 for Kibana:
$ sudo nano /etc/nginx/sites-available/default
- Add the following in the file and save and exit file:
server {

listen 80;

server_name example.com;

auth_basic "Restricted Access";

auth_basic_user_file /etc/nginx/htpasswd.users;

location / {

proxy_pass http://localhost:5601;

proxy_http_version 1.1;

proxy_set_header Upgrade $http_upgrade;

proxy_set_header Connection 'upgrade';

proxy_set_header Host $host;

proxy_cache_bypass $http_upgrade;

}

}
- For checking Nginx configuration:-
$ sudo nginx -t
$ sudo systemctl restart nginx
$ sudo ufw allow ‘Nginx Full’
4) Setup Filebeat on a different EC2 server with Amazon Linux image, from where logs will come to ELK:

- Following commands to install filebeat:
$ sudo yum install filebeat
$ sudo chkconfig –add filebeat
- Changes in Filebeat config file, here we can add different types of logs [ tomcat logs, application logs, etc] with their paths:-
filebeat:
prospectors:
–
paths:
– /var/log/tomcat/
input_type: log
document_type: tomlog
registry_file: /var/lib/filebeat/registry
output:
logstash:
hosts: [“elk_server_ip:5044”]
bulk_max_size: 1024
- After changes done, save and exit the file and restart filebeat service with:-
$ service filebeat restart
$ service filebeat status [It should be running].
5) Setup Logstash in our ELK Ubuntu EC2 servers:
- Following commands via command line terminal:
$ sudo apt-get update && sudo apt-get install logstash
$ sudo systemctl start logstash.service
- Logstash Parsing of variables to show in Kibana:-
Make file in /etc/logstash/conf.d as “tomlog.conf” and add the following:
input {

beats {

port => 5044

ssl => false

}

}

filter {

if [type] == "tomlogs" {

grok {

patterns_dir => ["./patterns"]

match => { "message" => "%{IPORHOST:IP} - - %{SYSLOG5424SD:timestamp}%{SPACE}%                                                              {NOTSPACE:deviceId}%{SPACE}%{NOTSPACE:sessionId}%{SPACE}%                                                                                  {NOTSPACE:latitude}%{SPACE}%{NOTSPACE:longitude}%{SPACE}%                                                                                  {QUOTEDSTRING:query_string}%{SPACE}%{NOTSPACE:response}%{SPACE}%                                                                {NOTSPACE:byte_sent}%{SPACE}%{NOTSPACE:response_in_milli}" }

}

}

}

output {

elasticsearch {

hosts => ["localhost:9200"]

sniffing => true

manage_template => false

index => "%{[@metadata][beat]}-%{+YYYY.MM.dd}"

document_type => "%{[@metadata][type]}"

}

}
- For testing Logstash config:
$ sudo /usr/share/logstash/bin/logstash –configtest -f /etc/logstash/conf.d/
- After that restart all ELK services:
$ service logstash restart
$ service elacticsearch restart
$ service kibana restart
6) Browser: Kibana UI setup:

- To load Kibana UI:
Search: http://elk_server_public_ip
- Then add username and password for Kibana: admin/change_password.
- Go to Management: Add index: filebeat-* .
- Discover page should now show your system logs parsed under filebeat-* index.
7) Setup Elastalert for Email Alerting system:
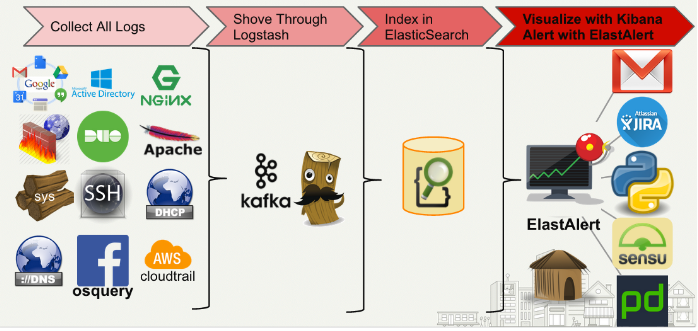
- SSH again in ELK EC2 Ubuntu server and do following:
- Add cron in /etc/crontab:-
00 7 * * * ubuntu cd /home/ubuntu/elastalert && ./run_elastalert_with_cron.sh
- Install elastalert on Ubuntu server:
$ git clone https://github.com/Yelp/elastalert.git
$ pip install “setuptools>=11.3”
$ python setup.py install
$ elastalert-create-index
- Create rule:
$ cd ~/elastalert/rules && touch rule.yml
$ cd ~/elastalert
$ vim config.yml
- Add following for main config.yml file:
es_host: “localhost”
es_port: 9200
name: “ELK_rule_twiin_production”
type: “frequency”
index: “filebeat-*”
num_events: 1
timeframe:
hours: 24
filter:
– query:
query_string:
query: ‘type:syslogs AND SYSLOGHOST:prod_elk_000’
alert:
– “email”
realert:
minutes: 0
email: “example@email.com”
- Changes in rules/rule.yml:
rules_folder: rules
run_every:
minutes: 30
buffer_time:
hours: 24
es_host: ‘localhost’
es_port: 9200
writeback_index: elastalert_status
smtp_host: ‘localhost’
smtp_port: 25
alert_time_limit:
days: 0
from_addr: “your_addr@domain.com”
- Cron script for running Elkastalert to send Email once a day:-
#!/bin/bash
curl -X GET “http://localhost:9200/elastalert_status”
curl -X DELETE “http://localhost:9200/elastalert_status”
pkill -f elastalert.elastalert
cd /home/ubuntu/elastalert
cd /home/ubuntu/elastalert && python -m elastalert.elastalert –config config.yaml –rule rules/frequency.yaml –verbose
Save and exit Shell script.
Now, it will run daily at 7:00 UTC according to my cron setup in the first step!!!
Let’s have a demo !!!
1) SSH to EC2 server [my case its Amazon Linux machine] where logs are getting generated:-
- Go to the directory where we installed Filebeat service to create indices of our logs:
$ cd /etc/filebeat
$ vi filebeat.yml
- Put your ELK server’s IP address for getting output in that server:-
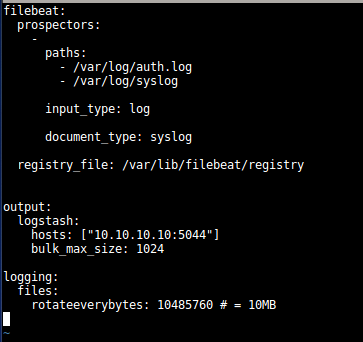
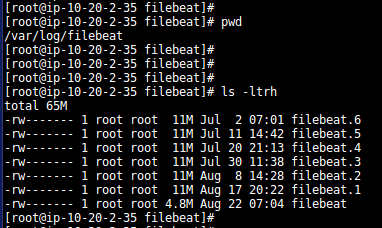
- Logs for Filebeat service will be stored at location: /var/log/filebeat:
$ cd /var/log/filebeat
$ ls –ltrh
- The logs we need for indexing via Filebeat will be our tomcat logs, we can have them anywhere:-
- In my case , they are at location: /var/log/containers/:

- Now, let’s jump to ELK server to check how indices are coming there:-
- Check the status of all ELK services:-


- Go to Logstash conf directory to see the parsing of logs:
$ cd /etc/logstash/conf.d
$ vi tomlog.conf
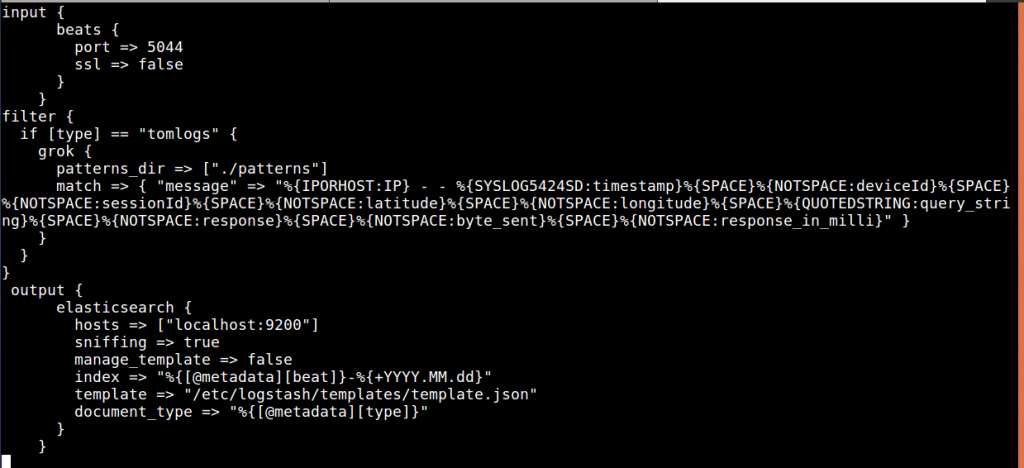
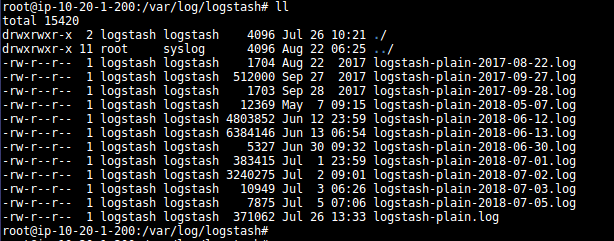
- Logs for Logstash service , will be at location: /var/log/logstash:
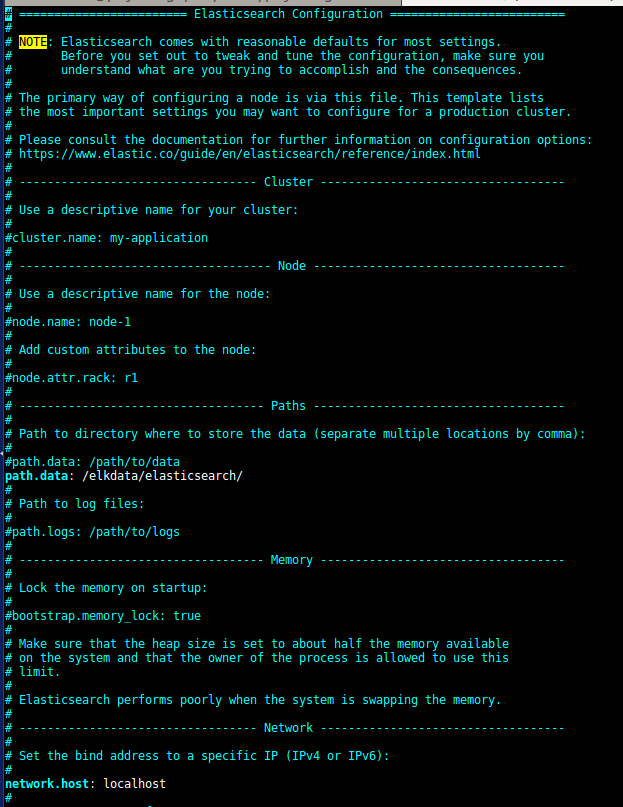
- Now let’s check our Elasticsearch conf, at location /etc/elasticsearch:
- You can define indices storage location and host in elasticsearch.yml:-
- We can check elasticsearch services’s logs at /var/log/elasticsearch:

- Lets checkout Kibana conf at location /etc/kibana:
- We just need to define the host for Kibana UI:

- Now, let’s move to Kibana UI
In browser: http://public_ip_elk_server
- Enter username and password for Kibana, then it all starts:

- Once you are logged in, you will go to Management:
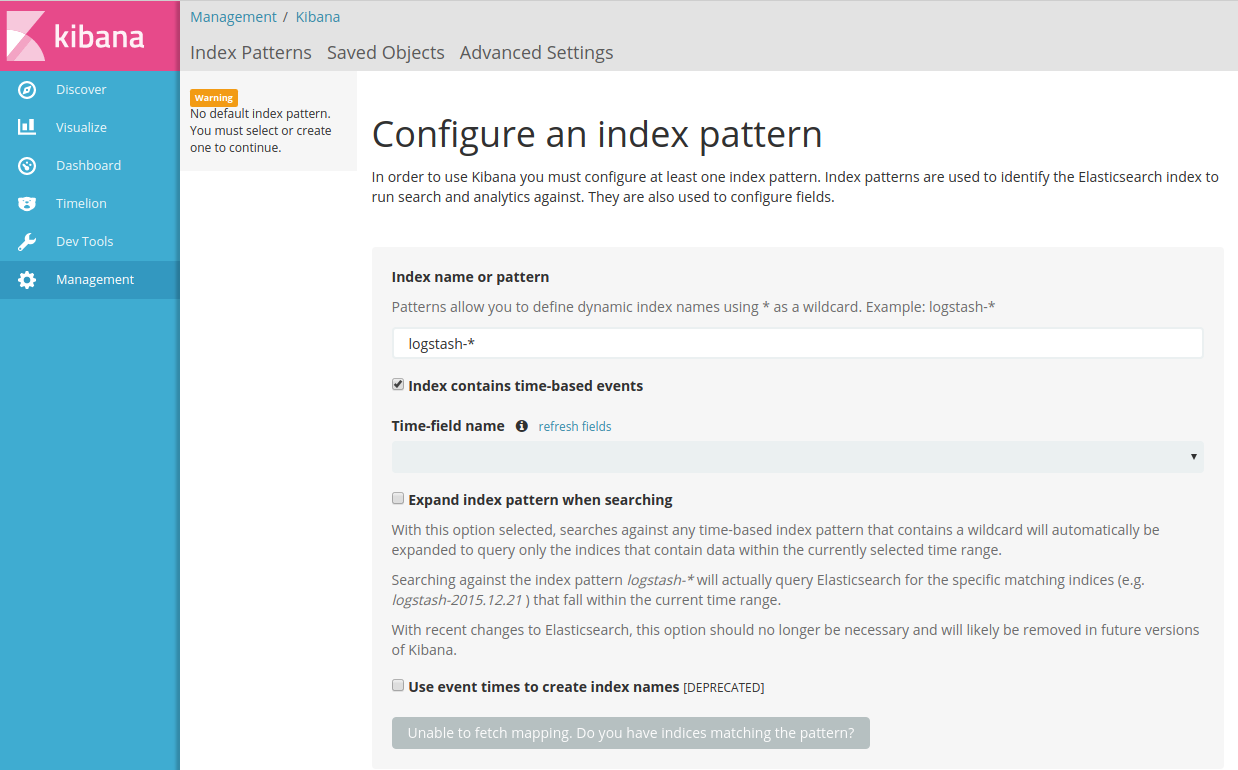
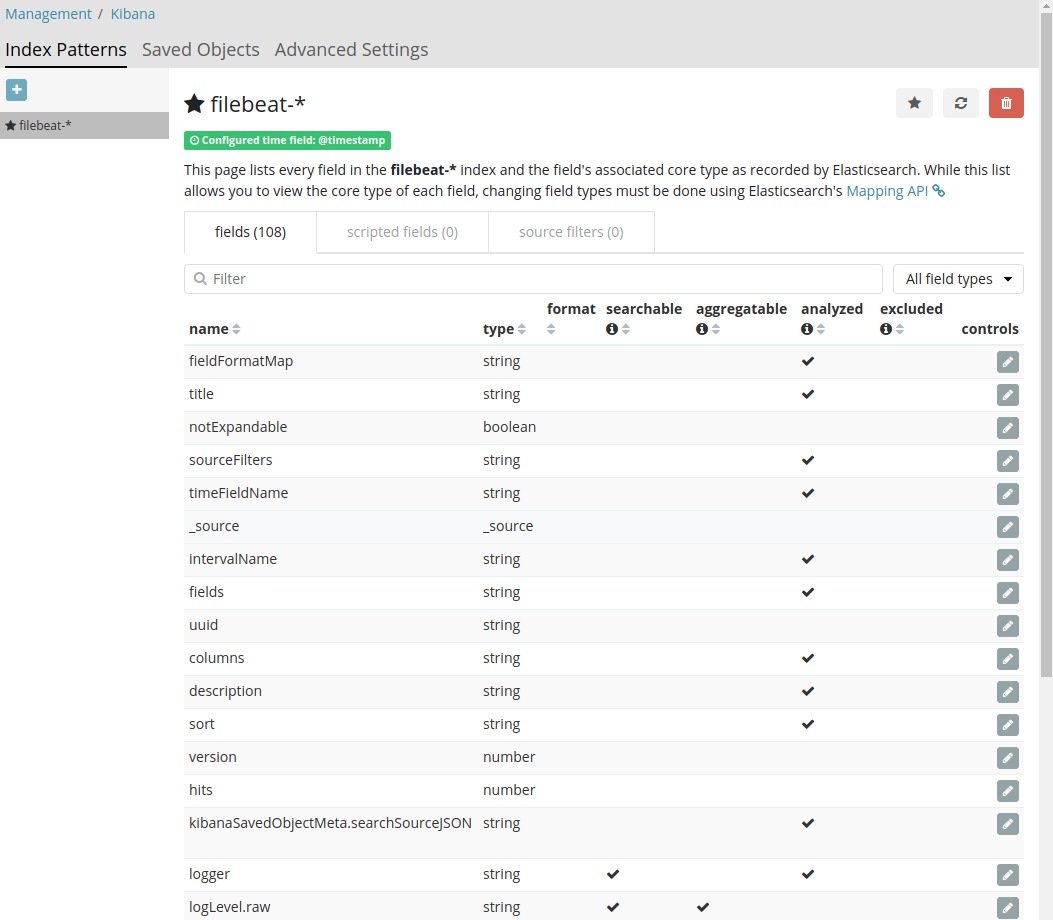
- Create the index for logs, for me, it’s filebeat-*:
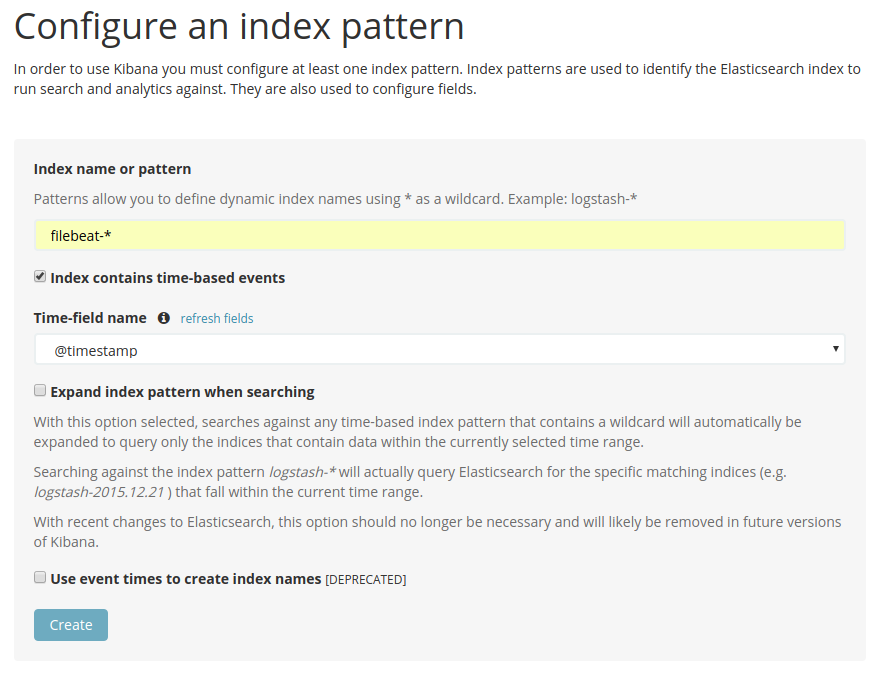
- As soon we create index pattern: All parsed fields will come there with details as
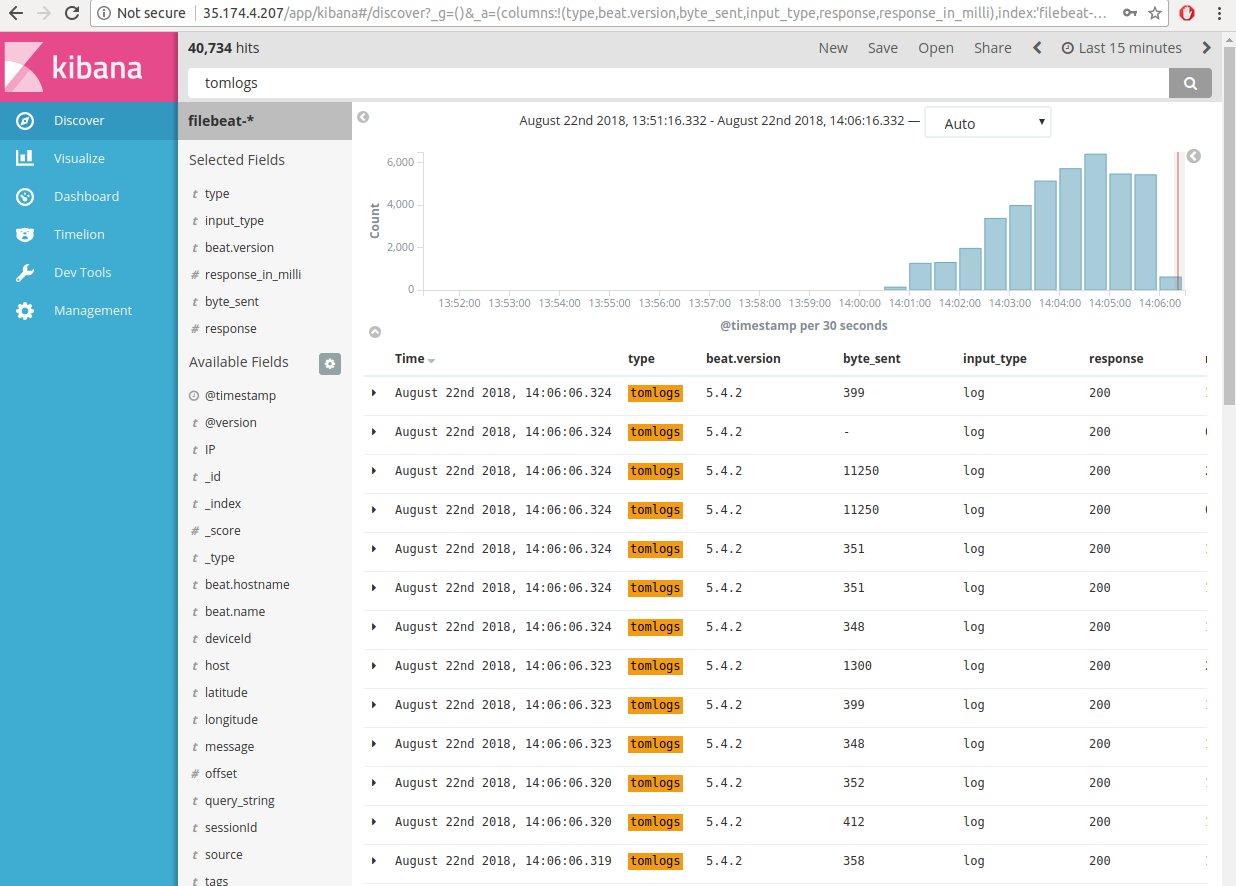
- Then we can search our query normally and add fields we want to check values of as:
- Let’s check, how to create a visualization in Kibana:

- We can choose our desired graph pattern:
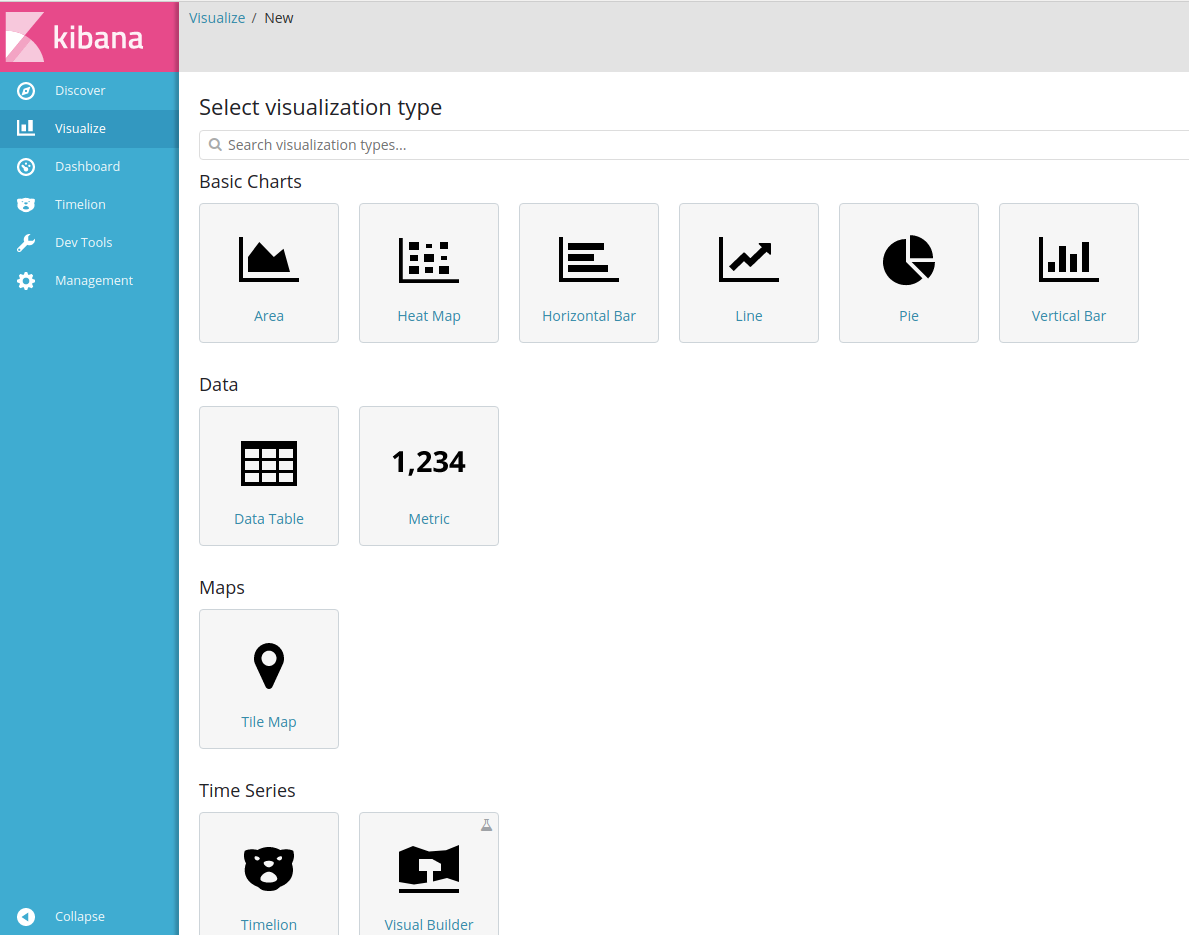
- I am choosing Vertical bar:

- Now for graphs, we need parameters to be framed in X-Y axis:
- Let’s make a new search and save it first for Visualizations:
My search is:- “type:tomlogs AND response:200”:
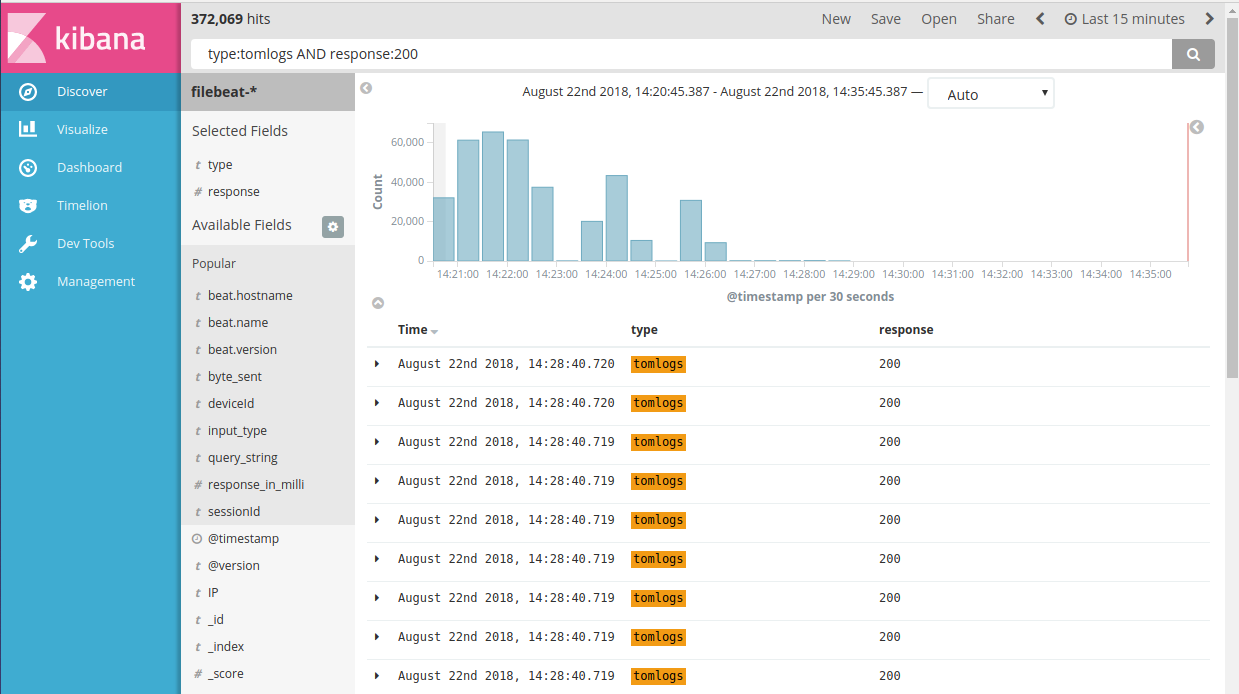
- Now save the search in Kibana for further making visualizations:

- Now go to the Visualization board again:

- Now we can select our saved search to make visualizations:
- We selected our Y-axis to be a field: Response with Aggregation: Average:
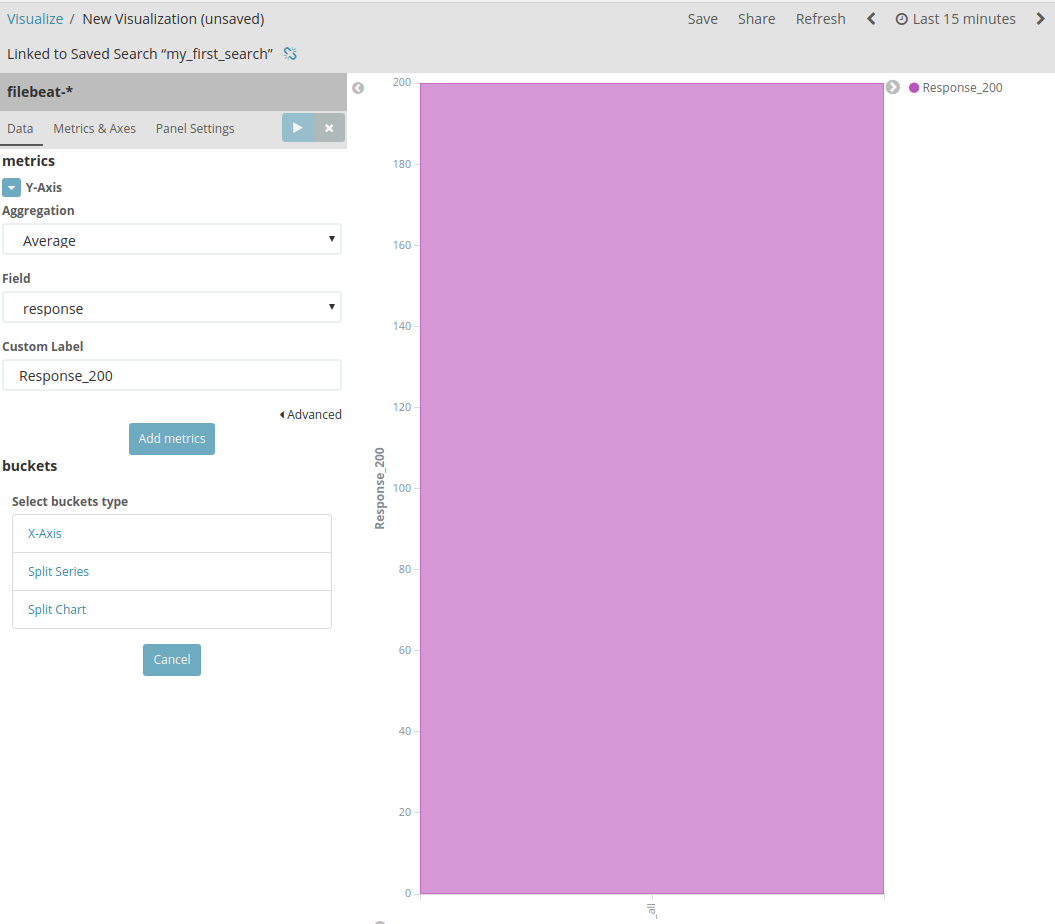
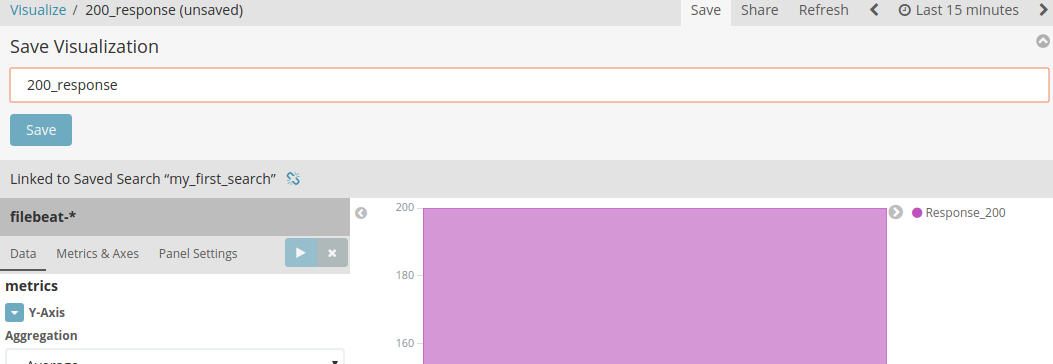
- Now save your visualization:
- Now I made more responses to make a dashboard further:

- Now let’s jump to Kibana Dashboards:

- Create a dashboard:
- As we start, Kibana will ask to add visualizations:
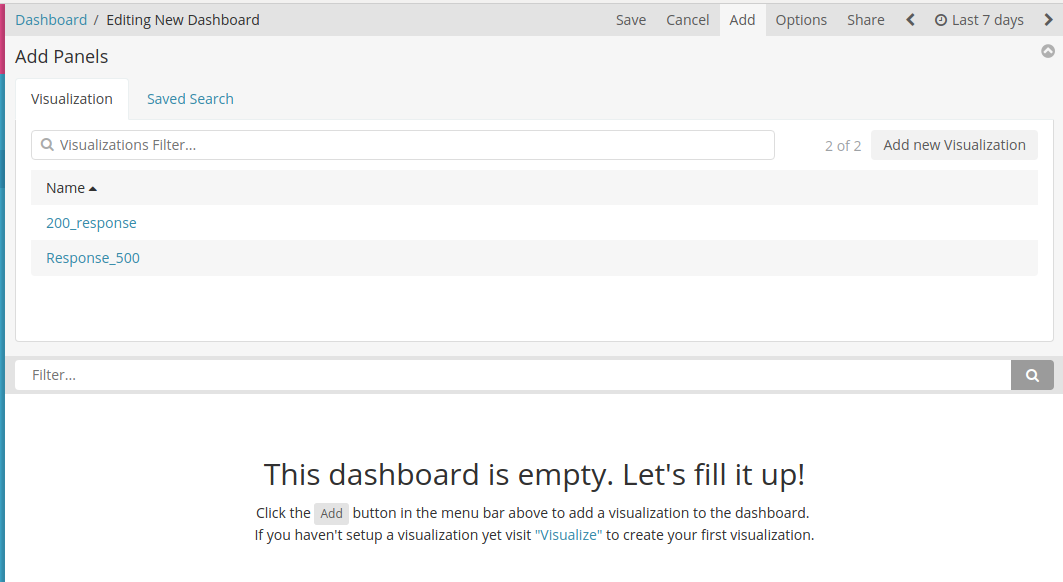
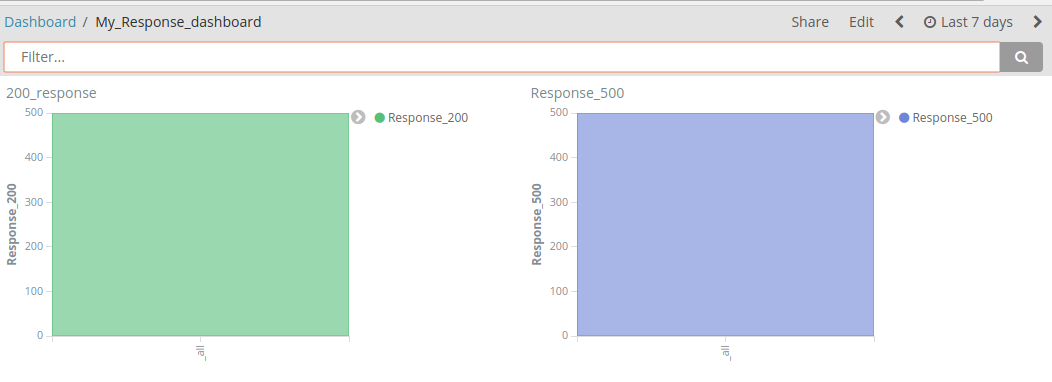
- I chose both of my visualizations:
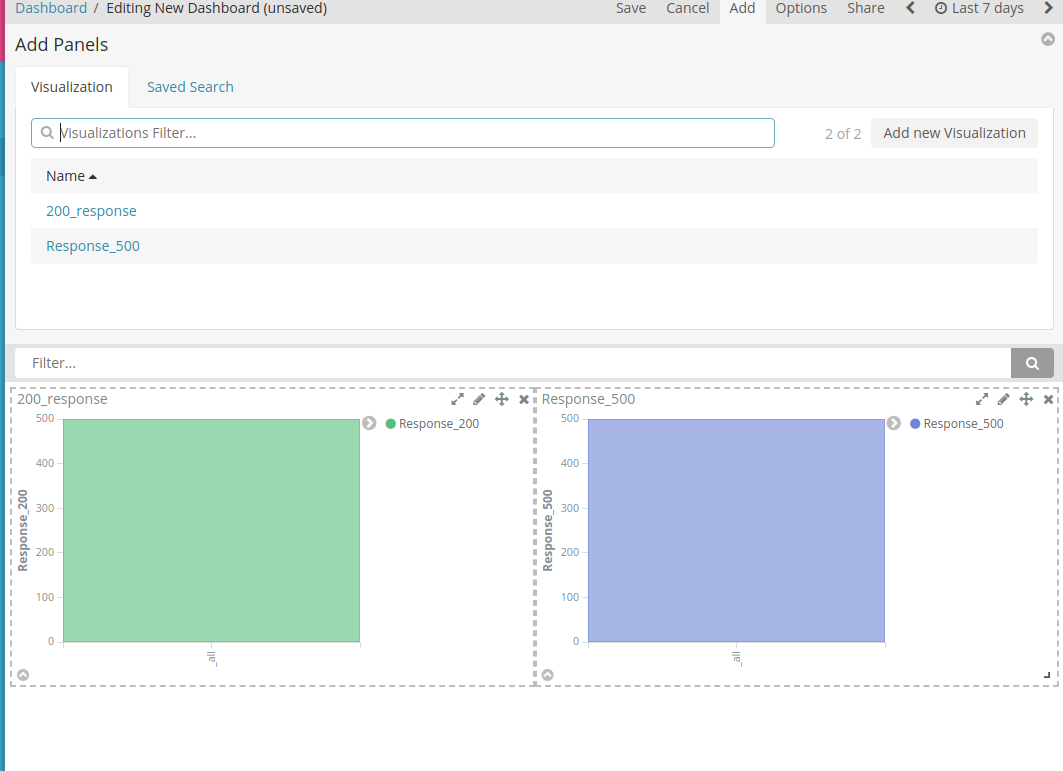
- Save your dashboard:


- Now you can browse more out of your dashboard according to Time Range at right top corner:
- Just for little insight of Dev Tools:
- We can query using APIs for our mappings or templates or Indices:
- Let’s have all indices for the query as:

Hence, we have covered almost all features of Kibana !!!
Conclusion:
The ELK Stack is a fantastic piece of software. ELK stack is most commonly used in log analysis in IT environments (though there are many more use cases for the ELK Stack starting including business intelligence, security and compliance, and web analytics).
Logstash collects and parses logs, and then Elasticsearch indexes and stores the information.
Kibana then presents the data in visualizations that provide actionable insights into one’s environment.


